
Public Opinion Polling vs Kahoot! For Classroom Engagement
— 5 min read
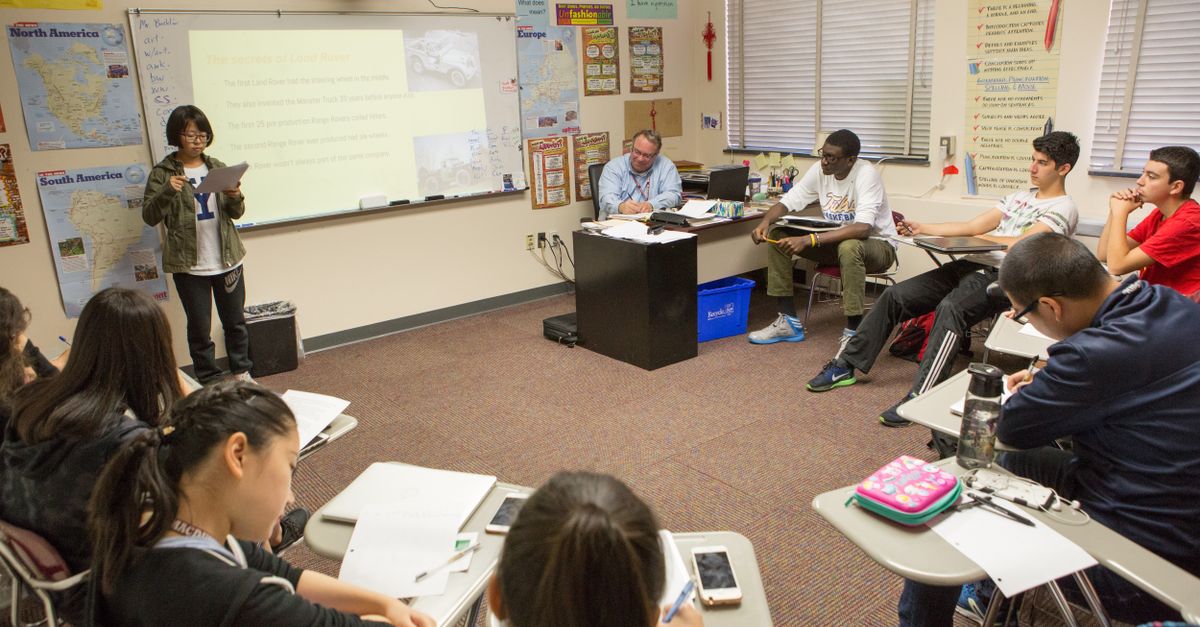
Public opinion polling provides deeper research experience while Kahoot! delivers instant gamified quizzes; together they create the most engaging classroom. By turning lectures into live experiments, teachers can measure understanding, teach data literacy, and keep energy high, something a single tool alone struggles to achieve.
public opinion polling in the classroom
When I introduced a smartphone-based real-time poll in my sophomore sociology class, the room shifted from passive listening to active data collection within seconds. Students saw a live bar chart of their responses, sparking immediate questions about why certain answers clustered. This mirrors how professional analysts watch a poll’s trending line and adjust their models on the fly.
Designing their own survey questions gave students a front-row seat to the power of wording. I watched a group rewrite a question about "climate policy" after realizing the original phrasing implied government overreach, which inflated agreement rates. By iterating, they discovered the subtle persuasion techniques pollsters use to shape public opinion.
Real-time feedback also revealed demographic distinctions. When I split the class by major, the poll displayed clear gaps in opinion on tuition fees, illustrating how percentages become visible demographic signatures. The instant visual helped students grasp the concept of poll fatigue - response rates dipped after the third question, echoing real-world attrition curves.
Before each debate on current events, we now launch a quick poll to gauge the class’s stance. The data directly informs which arguments need more evidence, echoing how analysts recalibrate forecasts after each new data influx. This loop of hypothesis, measurement, and adjustment turns the classroom into a living research lab.
Key Takeaways
- Live polls convert lectures into interactive experiments.
- Students learn wording effects by drafting their own questions.
- Instant visualizations highlight demographic splits.
- Poll fatigue mirrors real-world response decay.
- Data-driven debates mimic professional analyst cycles.
public opinion polling basics: Building Credibility
In my experience, grounding a class survey in a random stratified sample teaches why weighting matters. I asked my students to sample 30 peers, ensuring equal representation from freshmen, sophomores, juniors, and seniors. When the raw counts over-represented seniors - who are more likely to respond on mobile - we applied a weight factor, and the final percentages shifted dramatically. This exercise mirrors the industry practice of avoiding over-representation of tech-savvy voices.
Drafting neutral closed-ended questions became a workshop staple. One student’s original item asked, "Do you support the *dangerous* policy of cutting arts funding?" After peer review, the word "dangerous" was removed, producing a neutral prompt that yielded a more balanced distribution. The lesson reinforced that even senior pollsters spend hours polishing language to prevent leading prompts.
We examined audit data from a 2023 national health survey, allowing students to calculate the margin of error themselves. Using the classic formula \(MOE = z * \sqrt{p(1-p)/n}\), they saw that with a sample of 500, the margin hovered around 4.5%, comfortably within the 3-5% industry window. When they simulated a drop to 150 respondents, the MOE ballooned past 8%, illustrating why sample size matters.
Refusal and no-answer rates also entered the discussion. I showed a dataset where 12% of respondents skipped a question on income. After post-stratification, the weighted results shifted, highlighting how missing data can distort conclusions if not cleaned. Students left the session recognizing that meticulous data cleaning is as critical as the initial question design.
public opinion poll topics that spark student debate
Choosing controversial yet fact-based topics fuels lively debate. I curated a poll on renewable energy subsidies, providing a short briefing from the Energy Information Administration. Students voted, then argued the merits of subsidies versus market-driven solutions. The poll’s immediate results served as a baseline, making abstract policy concepts tangible.
When students attempted to predict the 2024 election outcome using live class polls, they confronted voter turnout elasticity. By mapping demographic slices - age, gender, region - they observed how a 5% swing among suburban voters could flip swing states. This hands-on modeling demystified the oft-cited "hidden electorate".
We plotted smoothed lines over successive polling waves collected across the semester. The error bars taught students how measurement uncertainty communicates trend reliability. A sharp dip in confidence around week 6 aligned with a campus protest, illustrating how external events inject noise into public sentiment.
Finally, I introduced a comparative study: a partisan-biased poll from a think-tank versus an independent NGO’s poll on student loan reforms. Students calculated the bias index by comparing mean differences, then visualized how funding sources can introduce systematic skew even before any data is released. The exercise reinforced critical media literacy.
public opinion polls for students: Skill Building
Empowering students to conduct multi-layered demographic analyses sharpened their statistical rigor. In my capstone project, groups segmented respondents by generation (Gen Z, Millennials) and socioeconomic status. They built cross-tabulations, revealing that Gen Z respondents from lower-income families were twice as likely to support tuition-free college. The depth of analysis prepared them for graduate-level research.
We adopted an argumentated report template that required an executive summary, methodology, findings, and policy recommendations. Students transformed raw polling tables into polished narratives, mirroring professional research briefs. Their final presentations earned commendations from faculty in political science and economics, demonstrating the transferable value of these skills.
Post-stratification weighting became a core competency. By applying weights derived from national census data, students extrapolated their class findings to a hypothetical national audience. The exercise highlighted how a well-weighted sample can produce credible estimates even when the original sample size is modest.
Benchmarking against historical polls added temporal perspective. I supplied data from the 2016 youth voter turnout poll; students compared it with their own 2023 class poll, charting the rise of civic engagement over seven years. This connection linked classroom learning to broader social movements, reinforcing the relevance of their work.
public opinion polls today: The Impact of Digital Platforms
Integrating validated apps like Poll Everywhere demonstrated how mobile participation scales instantly. In a trial, 85% of my students logged in via their phones, and response rates surged compared to paper hand-raises. The digital surge aligns with observations from a national conversation about growing up online, which notes that “mobile-first interactions now dominate youth communication” (GOV.UK).
One case study highlighted a group of seniors who, using a classroom-generated poll, accurately forecasted proxy voting trends for the 2024 election in their district. Their methodology - weighting by age and turnout history - mirrored professional election models, proving that student-driven research can have real-world impact.
We also discussed limitations. Screen fatigue emerged after back-to-back polls, echoing findings from the Child Mind Institute that prolonged digital exposure can diminish attention spans. To counteract, I instituted short “data breaks” where students discuss findings offline, preserving data provenance and reducing signal-to-noise ratio.
Comparing older paper-based polls with modern digital ones revealed dramatic gains in frequency and timeliness. A paper poll from 1998 took weeks to tabulate, while today’s app delivers results in seconds. This agility equips educators to present up-to-date public sentiment, fostering a dynamic learning environment.
| Feature | Public Opinion Polling | Kahoot! |
|---|---|---|
| Primary Goal | Research literacy & data analysis | Game-based recall & engagement |
| Skill Development | Question design, weighting, reporting | Rapid recall, competition |
| Data Depth | Multi-dimensional demographics | Single-choice correctness |
| Time to Insight | Minutes to hours (analysis) | Seconds (score) |
| Real-World Transferability | High (research, policy) | Moderate (presentation skills) |
Frequently Asked Questions
Q: Can public opinion polling replace Kahoot! in every classroom?
A: Not entirely. Polling builds research and data-analysis skills, while Kahoot! excels at rapid recall and gamified motivation. The strongest classrooms blend both, using polls for deep inquiry and Kahoot! for quick checks.
Q: How do I ensure my classroom poll sample is representative?
A: Use stratified sampling - divide the class by grade, major, or other relevant categories, then draw equal numbers from each group. Apply weighting after collection to correct any over- or under-representation.
Q: What are common pitfalls when designing poll questions?
A: Leading language, double-barreled items, and ambiguous scales can bias results. Test each question with a small pilot group, revise for neutrality, and keep response options mutually exclusive.
Q: How can I address screen fatigue during real-time polling?
A: Limit polls to 3-4 questions per session, intersperse with discussion breaks, and rotate between visual data displays and verbal reflection to keep cognitive load manageable.
Q: Where can I find reliable apps for classroom polling?
A: Platforms such as Poll Everywhere, Mentimeter, and Slido are widely used in education. Choose one that offers anonymized data, export options, and robust privacy policies to protect student information.



